A usage meter for Claude Code that stays on screen
I run Claude Code most of the day, and the question I kept asking was the same one: how much
of my limit is left? Claude Code answers that with /usage. But typing it means interrupting
whatever the agent is doing, and I typed it often enough that it became a habit I didn’t want.
So now the numbers just sit in the corner of the screen.
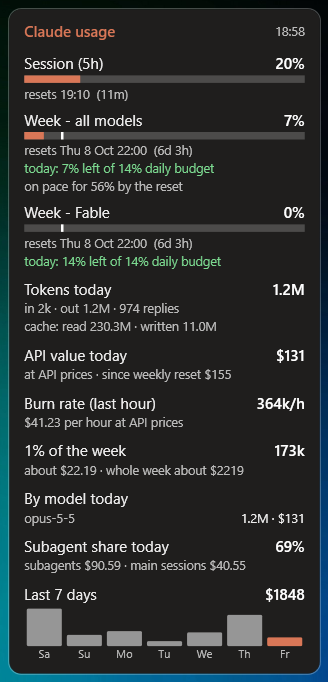
The top part is the core: one bar per limit (the 5-hour session, the week, and any per-model week your plan has) with the time until it resets. The bar turns amber at 60 % and red at 85 %. It sits on top of every window, you drag it wherever you like, and it starts with Windows. Everything below the bars came a few days later and is described in the update at the end.
It’s one PowerShell file and one small C# file, with no install and nothing to download besides the repo: github.com/F3S0J/claude-usage-widget. There is also a one-page overview with a mock of the widget and its themes.
Where the numbers come from
/usage doesn’t calculate anything itself. It asks Anthropic’s servers, at
api.anthropic.com/api/oauth/usage, with the login token Claude Code already has. On Windows
that token sits in %USERPROFILE%\.claude\.credentials.json. The widget reads it and makes
the same request every two minutes, so the numbers match /usage exactly.
Two things to know before you copy this:
- That endpoint isn’t a documented public API. It’s what the official client uses, so it works, but it can change without notice. If it does, the widget will say “offline” and this post will be out of date.
- The widget only reads the token, it never refreshes it. Refreshing a login token usually hands you a new refresh token and invalidates the old one, which here would log Claude Code itself out. The trade-off: if the token expires while Claude Code is closed, the widget waits until you open Claude Code again.
F9: the terminal as a drop-down
Once the widget was running all day anyway, it could do one more job. I have a lot of windows open, and the Claude terminal is the one I keep hunting for.
- F9 brings the Claude window to the front. If it’s already in front, F9 minimizes it. If there’s no Claude window, F9 opens one.
- Shift+F9 opens another Claude session as a new tab in that same window.
So it’s one window with all your sessions as tabs, and one key to show or hide it. It’s a global hotkey registered with Windows, which has a price: while the widget runs, no other program gets F9. If you recalculate spreadsheets with F9 in Excel, change the key at the top of the script.
Three things that broke on the first day
It said “offline” while the internet was fine. The server was answering 429 Too Many Requests. The usage endpoint is rate-limited, and I had restarted the widget over and over
while building it, with each start fetching immediately. The widget treated every error the same,
so a rate limit looked like a dead connection. Now it saves every good answer to a file.
On a 429 it shows those saved numbers with their time (the corner then reads, say,
“17:54 · limited” in amber), waits longer before the next try, and goes back to normal after the next
success. The reset countdowns keep ticking from the saved data, so even stale numbers stay useful.
F9 opened sessions that left no history. I started the widget from inside a Claude Code session while building it. Child processes inherit environment variables, so every terminal the widget opened carried the marks of a sub-session, and Claude Code treated them that way. The widget now strips those variables when it starts. A general rule: anything that launches programs for you shouldn’t be started from inside the thing it launches.
PowerShell closures broke shared state. The WPF event handlers first used
.GetNewClosure(), the textbook way to capture variables. It moved the handlers into their
own scope, and $script: variables quietly pointed somewhere else. The window handle the
hotkey tracked was never the one it had saved. Plain script blocks without the closure fixed
it.
Install
git clone https://github.com/F3S0J/claude-usage-widget.git
cd claude-usage-widget
powershell -ExecutionPolicy Bypass -File .\install-shortcuts.ps1
That puts a Claude Usage shortcut on the Desktop and in the Startup folder. You need Windows 10 or 11, Claude Code logged in with a Pro or Max subscription, and Windows Terminal for the hotkey. MIT licensed. Not affiliated with Anthropic.
Update, 2 October: a daily budget and token statistics
After a week with the bars, the question changed. It was no longer “how much is left?” but “how much of the week can I spend today?” A weekly limit that resets with 40 % unused is wasted, and one that runs out on day five is worse.
The daily budget. Each weekly row now has a line like today: 7% left of 14% daily budget, and a white tick on the bar marks where the bar should be by midnight. The budget
is whatever was free when the day began, spread evenly over the time until the reset. What
you don’t use today rolls into the following days, so the figure corrects itself. A second
line says where the week is heading: “on pace for 56% by the reset”.
Getting “today” right took three attempts in one afternoon. The first version counted from the moment the widget started, so starting it at 4 pm gave a third of a day’s budget. The second counted the whole day but treated everything used before the start as yesterday’s. The version that works remembers the last value it saw each day and uses that as the next morning’s starting point.
Token statistics. The usage endpoint only gives percentages. The actual token counts
are in the transcripts Claude Code writes to %USERPROFILE%\.claude\projects, one line per
reply. A small C# class reads them on a background thread, and only what was appended since
the last pass, so it costs nothing to refresh every 15 seconds and never touches the
rate-limited server. From that the widget shows:
- tokens today, split into input, output and cache
- what the same usage would cost at API list prices, today and since the weekly reset
- the burn rate over the last hour
- how many tokens 1 % of the weekly limit is worth
- the split by model, the share used by subagents, and the day’s most expensive sessions
- a bar chart of the last seven days
Two caveats. The transcripts only cover this machine, so chats in the browser are missing and the “1 % of the week” figure is an estimate. And the dollar figures are a comparison, not a bill: they use list prices written into the code, which need updating when prices change.
The number that surprised me most was the cache. On the day of the screenshot the model wrote 1.2 million tokens and read 230 million from cache. Almost all the volume of an agent session is the same context being read again on every step.
Preferences and looks. Ten blocks make a tall widget, so right-click → Preferences… switches each one off. The same menu has four colour themes, background transparency and a size setting; Ctrl + mouse wheel resizes it too.